

ADD = Days Sales Outstanding – Best Possible Sales Days Outstanding
Upflow → Blog → AR metrics
5 Key Accounts Receivable Metrics to Assess Your AR Performance
Alex Louisy
|
June 5, 2023
Generate AI summary


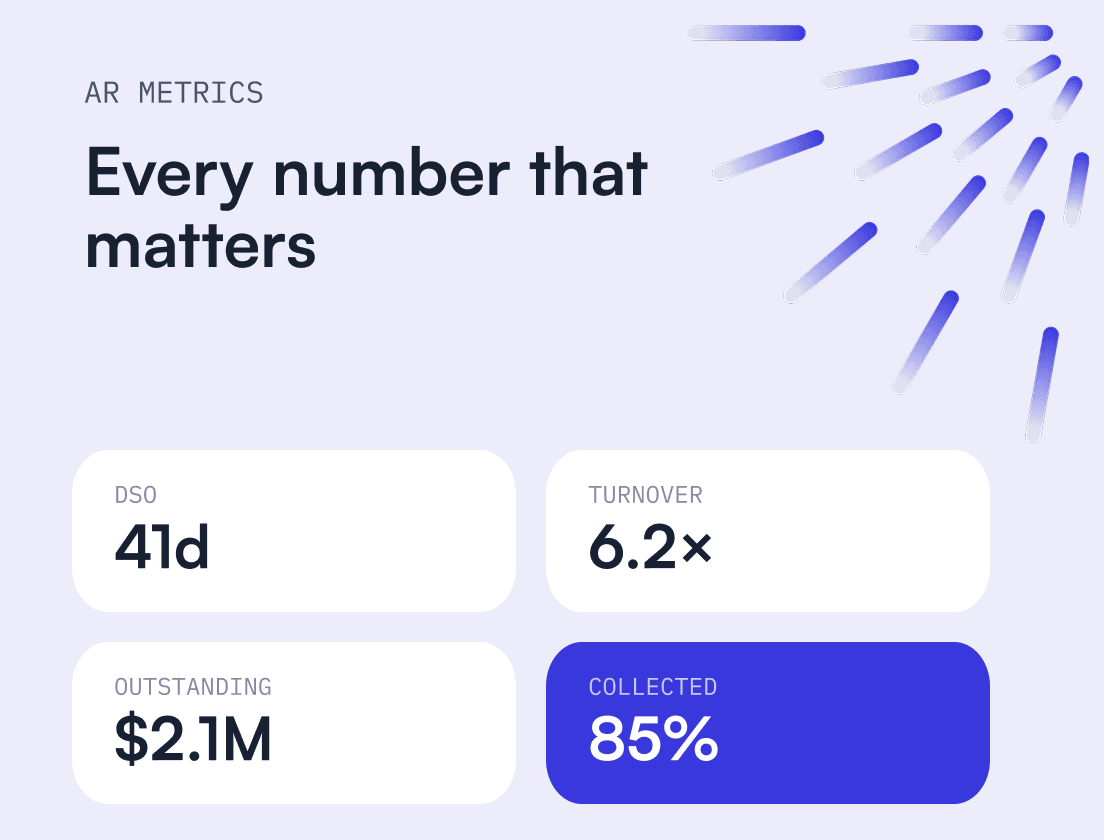
The top priorities of companies are to close deals and keep customers happy.
These don’t always translate into healthy finance. Ultimately, cash is the fuel that powers businesses.
While most businesses acknowledge this fact, few prioritize effective cash collection. It’s common for companies to measure the number of invoices to assess performance but not keep careful track of whether those invoices are paid on time if paid at all.
Well… What’s the meaning of making a sale if you don’t get paid promptly for it?
Effective accounts receivable management can play a crucial role in your company’s cash flow. A CFOs goal needs to be maximizing the companies working capital and liquidity whilst minimizing the number of write-offs.
The good news is, that you can improve your AR performance helped by the right analytics.
Days Sales Outstanding is an important metric that gives you a good view of your A/R performance. But it doesn’t have to be the only key metric to consider.
Today, we’ll be talking about the 5 key AR metrics your business and AR team should be following.
Remember, most businesses don’t track their AR performance. So no matter what you track, you’ll be going in the right direction if you track at least something.

1. Days Sales Outstanding

DSO = (Accounts Receivables at the end of the period / Gross revenues over the period) x Number of days in the period
Days Sales Outstanding is an essential AR metric to track as a key performance indicator. To put it simply, DSO measures how quickly — or slowly — your company collects payments (it calculates the average number of days it takes you to get paid). It’s one of the key metrics you’ll want to share with investors as it shows you’re building a healthy, cash-driven business that’s making a profit.
A high DSO means it takes a long time for customers to pay. A low one means people pay quickly, so your company has a steady cash flow coming in.
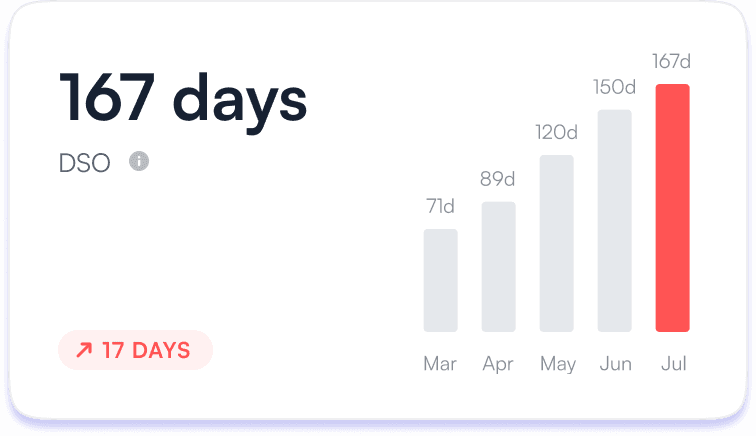
There are several methods to calculate your DSO, a simple formula is:
(Accounts Receivables at the end of the period) / (Gross revenues over the period) * (Number of days in the period)
Example: You DSO is: ($100,000)/($600,000)*(365)= 61 days
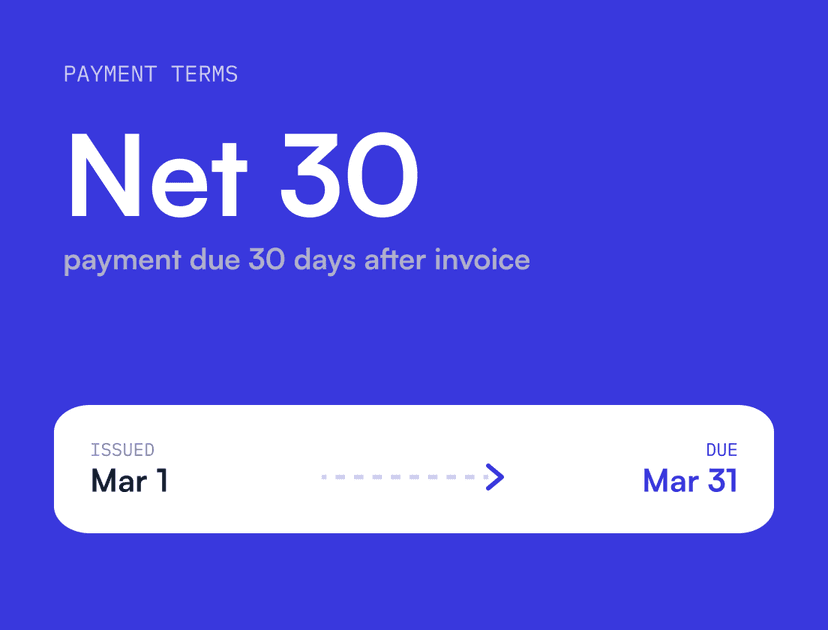
Ideally, DSO won’t exceed your payment terms by more than 50%. This means if you expect clients to pay within 30 days, your DSO should be 45 or below.
You may not meet this ideal. Most businesses focus on revenue and don’t even track this metric. Without tracking it, you cannot measure progress.
Regardless of the method, as long as you track DSO consistently and implement efficient account receivable collection processes, you’ll be able to set targets and monitor whether collections efforts are paying off.
Use our free spreadsheet to calculate your DSO!

2. Best Possible Days Sales Outstanding
Best Possible DSO = (Current Accounts Receivable x Gross revenues over the period) / Total Number of Days
Identifying your best possible DSO is important as a baseline measure to compare to your DSO.
It considers only current receivables that aren’t past due yet. This distinguishes it from the broader DSO measure, which also includes past-due bills when estimating how long it takes to get paid.
The best possible DSO is a best-case scenario. It shows how quickly your company will collect if everyone pays their bills on time.
Ideally, your best possible DSO would equal your DSO. That never happens in practice, though.
But while some gap between DSO and the best possible DSO is normal, a large discrepancy means your collection process isn’t as effective as it should be.
Closing that gap involves taking the right steps to implement efficient collection processes.
We’ve seen substantial improvement when our users implemented systematic receivables processes to ensure all unpaid invoices were followed up with a reminder.
"Before Upflow, our DSO was over 64 days. After implementation, our DSO was reduced to below 30 days with a 50% reduction in overdue invoices."

Gregory Labery
Billing Specialist @ Side
Check out how collection automation helped Side improve its AR process. Read the full customer story here.
You must be careful, though. Systematic reminders don’t mean flat, impersonal automated emails. Most of the time, these end up in the bin without even being read.
You need to tailor reminders to your customers’ specificities and avoid impersonal reminders as much as you can. You can, for example, automate the first reminder but send a highly personalized email when a larger account payment becomes late. This will also help understand why payment is late and contribute to your overall financial relationship management
Are late customer payments piling up? Have a look at our free guide with tips to get paid on time!
3. Average Days Delinquent
Average days delinquent measures how far behind customers typically fall on payments. Specifically, it refers to the average time period between when an invoice was due and when the client paid it. It can be measured across the company’s client database and at an account level to help you identify clients who rarely pay on time.
ADD isn’t used as a standalone metric. Typically, it’s measured in the long term and coupled with other key metrics, such as DSO, to help you assess whether collections efforts are trending in a positive direction. The two performance metrics should most often work in tandem, although that won’t necessarily be the case if a change in payment terms or another shift occurs.
For example, if a large outstanding invoice is finally paid, the ADD will quickly improve. However, that doesn’t mean your collection has suddenly become effective.
That’s why you shouldn’t look at your ADD in a snapshot. Instead, calculate it over time and evaluate it along with DSO. This will help you better understand the trend of your AR performance.
4. Collections Effectiveness Index
CEI = [(Initial Receivables + Monthly Sales – Total Receivables at End the Period) / (Initial Receivables + Monthly Sales – Receivables for the Current Period)] x 100
Collections Effectiveness Index, or CEI measures in percentage your ability to get funds from customers within a given period. It’s typically calculated monthly, although you can choose to track it over any period you like.
The closest this percentage is to 100%, the best. Although a perfect 100 is theoretically possible if your collections efforts are flawless, in general, this number should be above 80%.
Let’s take an example:Your receivables at the end of the month will be: Current Month Sales – Payments Received on the Current Month Receivable = $20,000And the total Receivables Balance at the end of the month will be: Receivable beginning of the month + Current month Sales – Payments Received for Outstanding Receivables – Payments Received on the Current Month Receivable = $60,000Then, you can apply the above formula:($100,000 + $40,000 – $60,000) / ($100,000 + $40,000 – $20,000) x 100 = 67%
We’ve prepared an excel spreadsheet to help you calculate this every month!

While DSO is focused on how long it takes for your company to get paid, CEI (collection effectiveness index) considers the amount of outstanding invoices and measures how effectively your company collects total payments due.
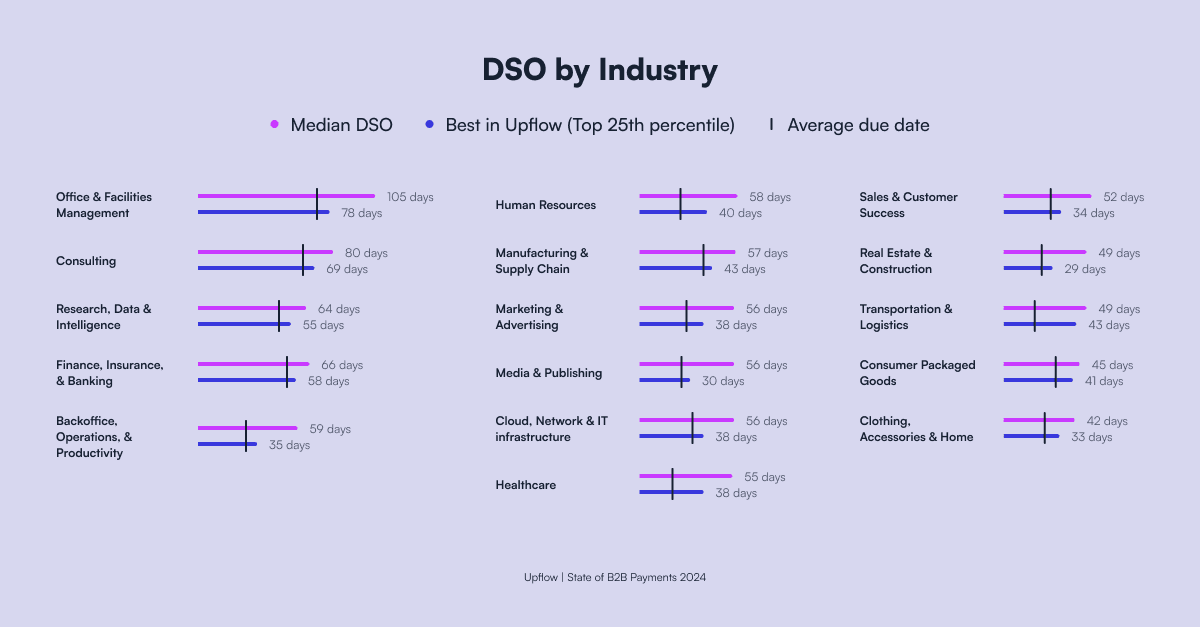
Some AR metrics can be compared with competitors to assess how quickly your company collects payments relative to the industry’s average. CEI isn’t used for this type of benchmarking against peers. Instead, it’s an internal measure of the A/R teams’ performance. Check out the table below and see how your business’s DSO compares to the industry median.
5. Accounts Receivable Turnover Ratio
Turnover Ratio = Net Average Credit Sales / Average Accounts Receivable
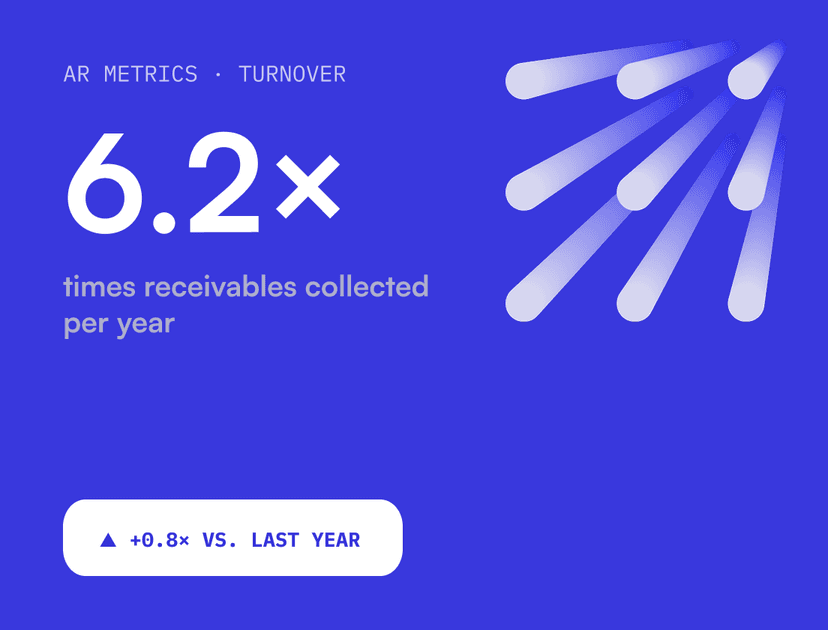
This metric assesses how effectively your company manages credit and how quickly your clients pay their bills. A higher ratio is preferred and suggests your A/R team is efficient and that your clients repay debts rapidly.
Let’s take an example: Here, your A/R turnover ratio is $100,000/$10,000 = 10.By dividing the number of days of that period by the A/R turnover ratio, you can calculate your average collection period. In our example, your average collection period would be 365 / 10 = 36.5 days.
A good AR turnover ratio is generally high and indicates that you have an efficient collections process. However, you may want to capture sales ahead of the competition or keep clients in dire economic situations. There, it won’t be a priority to have a higher ratio.
For a deeper understanding of this metric, check out our article on the Accounts Receivable Turnover Ratio.
How to Analyze and KPIs you Should be Tracking
Each account receivable metric requires you to collect substantial data, with accuracy. You’ll also want to collect the data consistently over time to compare your performance and identify how changes and optimizations impact your receivable performance.
Excel spreadsheets have the advantage of being cost-free, but they are limited when it comes to keeping track of advanced analytics. Your time is valuable and should be spent on higher value-added activities, like resolving an overdue payment dispute or lowering your bad debt, instead of focusing on making calculations that could easily be automated (removing the human error factor too!).
At Upflow, we’ve developed a free plan, Discover Upflow, which connects directly to your existing billing software. In 2 clicks, our system automatically generates reports of your most important Accounts Receivable KPIs such as DSO, Main debtors, Aging balance, Cash flow, or Billing cohorts. Make data-driven decisions to increase your collections performance.
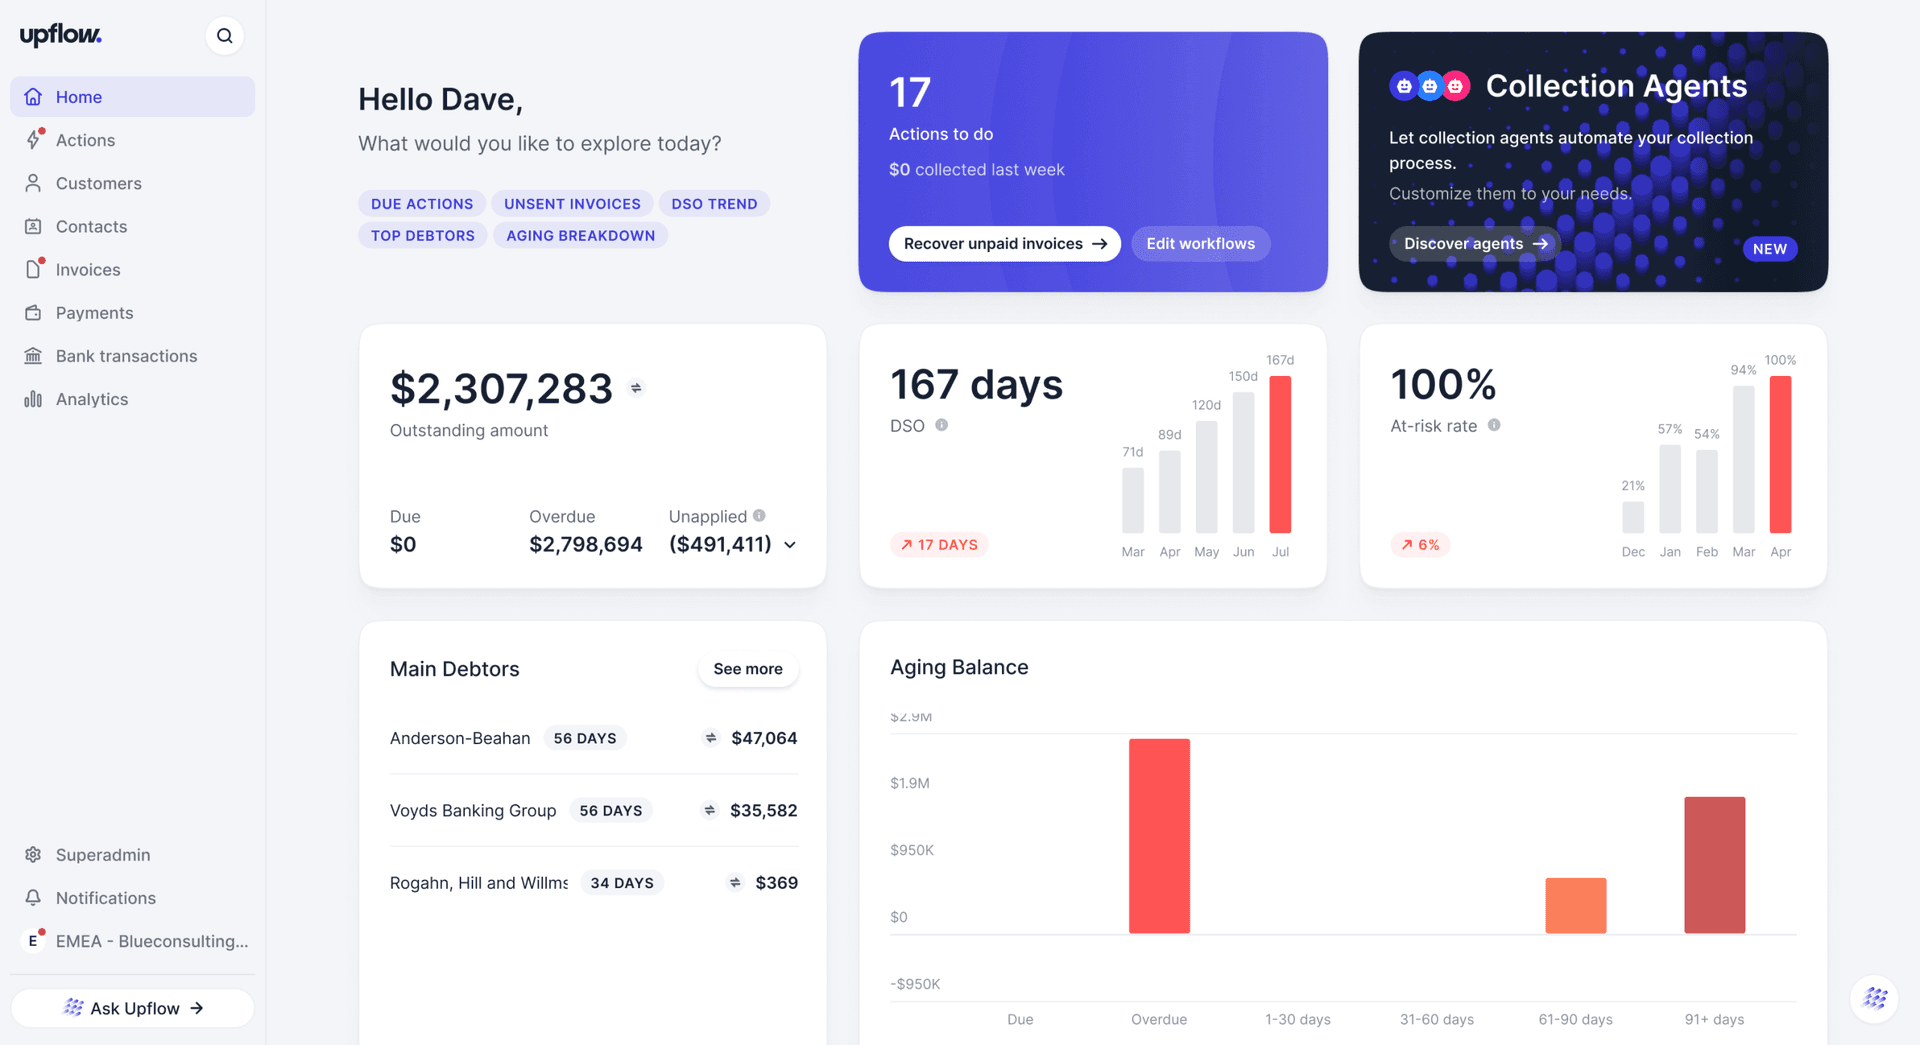
Need a big-picture view of all of your accounts-receivable data? Check out our free Discover Plan by Upflow.

Key takeaways
- Accounts receivable management plays a crucial role in a company's cash flow, and effective management can help maximize working capital and liquidity while minimizing write-offs.
- Days Sales Outstanding (DSO) is an important metric to track as it measures how quickly a company collects payments, and it's a key metric to share with investors as it shows a healthy, cash-driven business.
- The DSO formula is (Accounts Receivables at the end of the period) / (Gross revenues over the period) * (Number of days in the period). Ideally, DSO should not exceed payment terms by more than 50%.
- Best Possible Days Sales Outstanding (BPDSO) is another important metric to track as it is a baseline measure to compare to DSO. BPDSO considers only current receivables that aren't past due yet and is a best-case scenario of how quickly a company will collect if all bills are paid on time.
- It's important to track these metrics in real time. Use Accounts Receivable automation software like Upflow to help you do this with its AR dashboard.

Alex Louisy
Co-founder and CEO of Upflow
Alex is the Co-founder and CEO of Upflow, where he leads the company’s mission to revolutionize how B2B businesses manage their cash flow. Backed by top-tier investors like Hedosophia, YCombinator, Hexa, and Lorimer Ventures, with more than $25m in funding to date, he is a strong advocate for financial transparency and operational excellence, bringing a founder’s perspective to the biggest challenges and opportunities in modern revenue management.
Alex developed Upflow’s widely recognized “5 Maturity Stages of Cash Collection” framework, a model that has helped hundreds of companies build scalable and efficient finance operations. He also co-hosts The Growth-Minded CFO podcast, where he engages with finance and business leaders on innovative approaches to financial leadership. His thought leadership explores the intersection of business strategy, financial discipline, and organizational growth.
As a regular contributor to Upflow’s blog, Alex shares insights on leadership, scaling SaaS businesses, and the future of B2B finance. His writing helps founders, CFOs, and revenue leaders make smarter decisions and build financially resilient companies.

FAQs
Can’t find what you’re looking for?
Ask AI
DSO includes both current and overdue receivables and shows how long it typically takes your company to get paid. Best Possible DSO (BPDSO), on the other hand, only considers current (not overdue) receivables, representing a best-case scenario where all customers pay on time. Comparing the two helps you identify gaps in your collection process and opportunities to improve cash flow efficiency.
Related articles